
Salt Lake City Real Estate Market Report
This market report includes up-to-date information on the Salt Lake City Metro Area courtesy of the WFR-MLS as provided by Joel Carson, Salt Lake City's #1 real estate agent. Last Updated: April 2, 2024
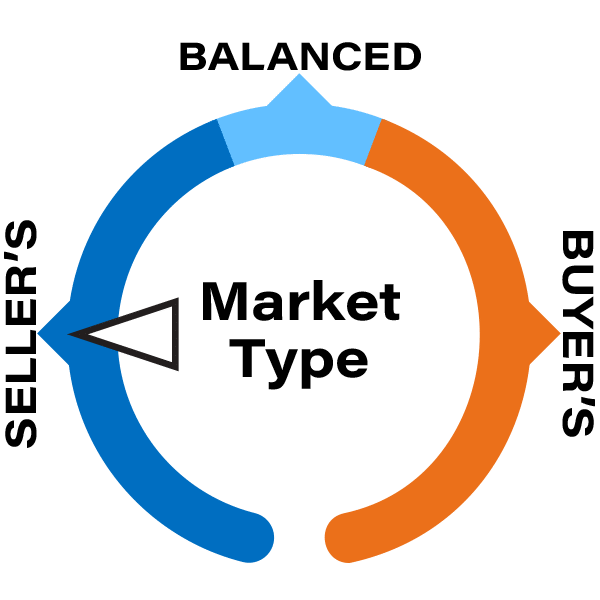
Is Salt Lake City a Buyer's or Seller's Market?


In March of 2024, there were 223 new single family home listings and 182 sold, which means that Salt Lake City currently has 1.3 months of inventory available (under 5 months available inventory is considered a seller's market). This places us firmly in a seller's market, as demand continues to outstrip supply.
Single Family Homes
Months of Inventory
1.3
.9% Increase
March 2023 vs March 2024
Median Sales Price
$585,000
4.5% Increase
March 2023 vs March 2024
Days on Market
38
28.3% Decrease
March 2023 vs March 2024
Are Salt Lake City Home Prices Dropping?
Prices have increased in comparison to last year.
The median sales price of single-family homes rose in March of 2024 by 4.5% when compared to March of 2023. Prices in Salt Lake City metro continue to rise, as there are more buyers in the market than available inventory.
Freddie Mac, 30-Year Fixed Rate Mortgage Average in the United States
4/1/1971-4/1/2024
How Much Does a House Cost in Salt Lake City?
Depending upon the size and type of home you choose, you can multiply the estimated square footage by avg. price per square foot to get an idea of how much a house might cost in Salt Lake City. The average square footage of a single family home in Salt Lake City is approx. 2,000 Sq. Ft. while the average for condos & townhomes is approx. 1,250 Sq. Ft.
Single Family Homes
Price Per Sq. Ft
$250
6.8% Increase
March 2023 vs March 2024
Condos & Townhomes
Price Per Sq. Ft.
$303
3.8% Increase
March 2023 vs March 2024
Is Now a Good Time to Buy a Home in SLC?
Although we are technically in a seller's market, it may still be a good time to buy. Many people are sitting on the sidelines hoping for mortgage interest rates to fall. If rates dip steeply, you will see more buyers enter the market, driving up home prices further. Buying today and refinancing at a lower interest rate when rates drop, can be a wise strategy.
Freddie Mac, 30-Year Fixed Rate Mortgage Average in the United States
4/1/1971-3/1/2024
Is Now a Good Time to Sell a Home in SLC?
Spring is when the real estate market naturally begins to pick up. There is still a high demand for housing and many buyers are looking to purchase right away. Homes are selling at historically high prices as a result.

Salt Lake County Real Estate Market
In March of 2024, there were 1,290 homes listed and 906 homes sold, which means that Salt Lake County currently has 1.7 months of single family, condo, and townhome inventory available. While this is slightly more than Salt Lake City metro, Salt Lake County is experiencing a robust seller's market.
Months of Inventory
1.7
39.9% Increase
March 2023 vs March 2024
Median Sales Price
$530,716
2.1% Increase
March 2023 vs March 2024
Days on Market
48
12.7% Decrease
March 2023 vs March 2024
Compare Home Prices in Popular Salt Lake County Cities
A year-over-year comparison of all dwelling types: Single family homes, condos, and townhomes show that the most populated cities in Salt Lake County are still seeing a steady increase in prices, with West Valley City being the only exception.
Median Sales Price
SFHs, Condos, & Townhomes
Salt Lake City
prices increased by
3.2%
March 2024 $530k
240 homes sold
vs.
March 2023 $514k
280 homes sold
Median Sales Price
SFHs, Condos, & Townhomes
West Valley City
prices remained steady
0%
March 2024 $430k
52 homes sold
vs.
March. 2023 $430k
64 homes sold
Median Sales Price
SFHs, Condos, & Townhomes
West Jordan
prices increased by
5.9%
March 2024 $535k
83 homes sold
vs.
March 2023 $505k
85 homes sold
Median Sales Price
SFHs, Condos, & Townhomes
Sandy
prices increased by
11%
March 2024 $635k
70 homes sold
vs.
March 2023 $572k
89 homes sold
Sales Slowing in Salt Lake County, Prices Inch Up
The number of homes sold in this Northern Utah county decreased by 15.2% in March compared to March 2024. That's not surprising, higher interest rates have got potential buyers teetering on the fence.
Believe it or not, Salt Lake County homes for sale just might be a bargain even at a median $531K, inventory is low and that increases demand. Federal Reserve Chairman Jerome Powell has indicated rates could still go down as many as three times this year as the U.S. economy stays steady. Low inventory and high demand are keeping prices up and when those rates come down, demand will be even higher. Prices are guaranteed to follow.
In West Valley City, home sales have slowed significantly (down 18.75%) but the median price of $430K stayed the same.
Fewer Salt Lake City homes sold in March compared to the same time last year (280 vs. 240) and the median price is up 3.2%.
Look for an even hotter market as temperatures rise. Remember, the closer a home is to the Salt Lake City Center, the more expensive it is likely to be.
All data, including all measurements and calculations of area, is obtained from various sources and has not been, and will not be, verified by broker or MLS. All information should be independently reviewed and verified for accuracy.